- Code
- Thursday, November 01, 2018
Investigating intermittent slowness
Recently several members of the team have mentioned that Jira has been occasionally slow throughout the day, so I went to investigate.
I hypothesized that the maximum Java heap space was set too low, but I wanted to prove it. For those who don’t know, Jira is a Java application so it runs in the Java Virtual Machine (JVM) environment. The JVM is allocated a specific amount of memory (based on your configuration) and can never use more than that amount, even if the computer the JVM is running on has way more memory available. Simply increasing Java heap space is often a temporary solution that doesn’t get to the root of the problem, so I wanted to rule out some other possible problems first.
Atlassian’s documentation warned that using a VM (as we are) can potentially impact performance, so I wanted to check to make sure the disk I/O times were up to par. Using an Atlassian analysis tool, I ran a benchmark test of open, read/write, close, and delete times. All results read in the top of the “OK” or bottom of the “Excellent” range, so we’re doing pretty well here.
I tested the latency of the network connection between the Jira application and database servers. The ping was 1ms, which is very fast; no problem here either.
Usually when you run out of heap space you get nasty out of memory errors and your application crashes, but that wasn’t the case here – the application was just running slow in certain situations. To view memory allocation over time I used a third party tool called GCViewer which analyzes garbage collection (GC) log files. Fortunately a coworker told me exactly when Jira was slow, which allowed me to narrow it down to a 10 minute window and generate this visualization of GC events between 1:20 and 1:30pm on Oct. 30th:
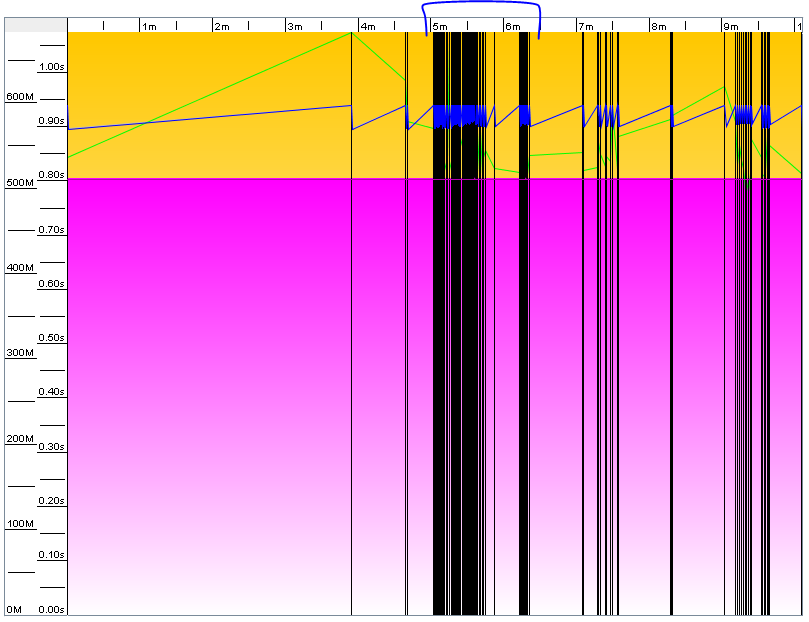
Check out the 5-6 minute mark. Black vertical bars are instances of full “stop-the-world” GC, where all non-GC threads must halt until the JVM is done garbage collecting. The blue line near the top is the allocated heap space. Ouch, no wonder we were slow. This is what’s called GC thrashing, and it happens when an application is hanging on for dear life due to low memory.
On Oct. 31st I significantly increased available heap space. Check out this graph for comparison from 1:20-1:30. The results speak for themselves.
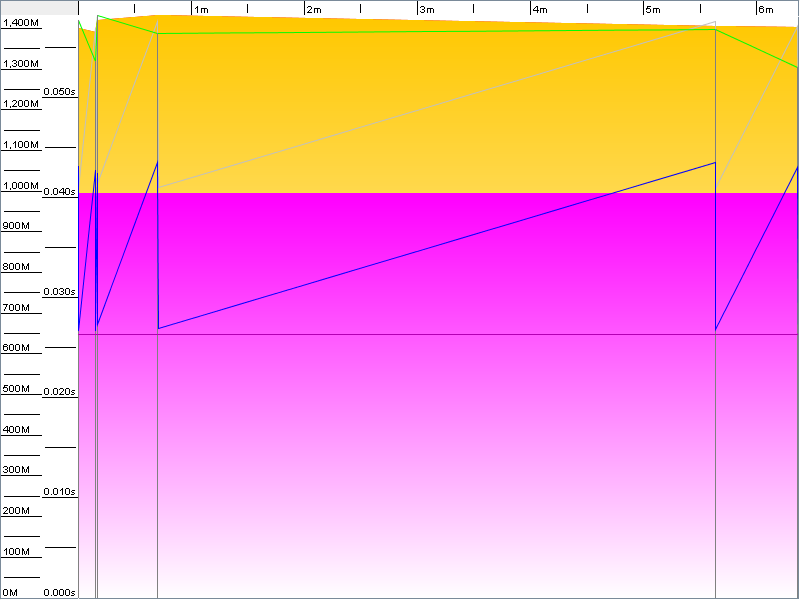
The number of GC events dropped from 94 to 6. I almost didn’t even bother generating the second graph. Memory allocation after garbage collection went from roughly 82% down to 37%. The application feels much snappier as you might expect and so far the issue appears to be resolved.